


07/13/2018
in Technology
Coding Continuous Delivery — Static Code Analysis with SonarQube and Deployment on Kubernetes et al. with the Jenkins Pipeline Plugin
Table of Contents
This article is part 4 of the series „Jenkins Pipeline for continuous delivery“
Read the first part now.
The first three parts (part 1, part 2, part 3) of this series of articles about Jenkins Pipelines describe basics, performance and tools such as Shared Libraries and Docker©. This last part is dedicated to the integration of static code analysis using SonarQube. At the end of the article series the reader finds out how to do deliver continuously to Kubernetes and gets suggestions for Continuous Delivery (CD) on other platforms.
The pipeline examples previously used will be successively extended in this article. The sample project is still the kitchensink quickstart from WildFly. All pipeline examples are realized in both declarative and scripted syntax. The current state of each extension can be tracked and tested at GitHub. Here, for each section (under the number mentioned in the heading) there is one branch for declarative and one for scripted syntax, which comprises the complete example. The result of the builds of each branch can also be viewed directly on our Jenkins instance . The numbering of branches continues from the previous parts. Docker© was number nine, so the static code analysis is the tenth example.
Static code analysis with SonarQube (10)
Static code analysis covers common error patterns, code style and metrics (e.g., code coverage) based on source or bytecode. Quality goals can then be determined on the basis of metrics, e.g., “Code coverage for new code must be greater than 80%.”
These steps are easy to automate and therefore are another means of quality assurance in a CD pipeline, in addition to the unit and integration tests already shown. The SonarQube (SQ) tool, which encapsulates the possibility for static code analysis in its own web application, is widely used. Plugins can be used here to integrate many programming languages and the rules of tools such as FindBugs, PMD and Checkstyle.
Integration into the Jenkins pipeline is done via the Jenkins plugin. After installation, the SQ instance is configured in Jenkins, typically using URLs and authentication tokens.
A webhook will also be set up in SQ, asynchronously informing Jenkins about the results of the Quality Gate checks. The webhook is provided by the SQ plugin on Jenkins (sonarqube-webhook).
The analysis can then be done, among others, by the SQ plugin for Maven on Jenkins. Listing 1 shows how this can be realized using scripted syntax in the Jenkins Pipeline.
node {
    stage('Statical Code Analysis') {
        analyzeWithSonarQubeAndWaitForQualityGoal()
    }
}
// ...
void analyzeWithSonarQubeAndWaitForQualityGoal() {
    withSonarQubeEnv('sonarcloud.io') {
        mvn ‘${SONAR_MAVEN_GOAL} -Dsonar.host.url=${SONAR_HOST_URL} -Dsonar.login=${SONAR_AUTH_TOKEN} ${SONAR_EXTRA_PROPS} ‘
    }
    timeout(time: 2, unit: 'MINUTES') {
        def qg = waitForQualityGate()
        if (qg.status != 'OK') {
            currentBuild.result = 'UNSTABLE'
        }
    }
}
Listing 1
The SQ plugin provides several steps in the pipeline:
withSonarQubeEnv()injects the values specified in the configuration for an SQ instance (here with the IDsonarcloud.io), such as the URL, as environment variables into the corresponding block.waitForQualityGate()waits for the call of the webhook, which informs about the state of the Quality Gate.
In Listing 1, if the result is negative, the build is set to unstable (yellow). Alternatively, the error() step can be called, which sets the build to failed (red).
A timeout is set to prevent the build from waiting indefinitely. For example, if no webhook is configured, the build will be aborted after 2 minutes.
Again, it’s a good idea to define the logic in its own analyzeWithSonarQubeAndWaitForQualityGoal() step to make the pipeline code more readable. In declarative syntax, at least the check of the Quality Gate must be written in a separate step or script block.
In the official pipeline documentation, it is recommended to execute the step waitForQualityGate() outside of a node in order to block it as little as possible. However, this results in code that is difficult to maintain. See the examples in GitHub in branch 10a, one each for scripted and declarative syntax. In declarative syntax, this means, among other things, that each stage is executed in its own build executor, which also significantly extends the overall runtime of the pipeline. Since SQ response times are typically few milliseconds, Listing 1 shows the pragmatic way, using only one node.
There are a few more advanced topics dealing with SQ, such as having the results of the analysis written directly as a comment in pull requests, or using the branch feature (not in the Community Edition). These features are conveniently provided by, e.g. the ces-build-lib shared library.
Deployment (11)
Once all quality assurance measures have been successful, deployment can take place to complete the CD pipeline. Depending on the degree of automation, the final step is deployment in production. It is recommended to operate at least one staging environment in order to reduce risks when deploying in production. One easy-to-implement logic to automate deployment of both staging and production is the use of branches in Source Code Management (SCM).
Many teams work with feature branches or GitFlow, in which the integrated development status flows together on the development branch and the master branch contains the productive versions. You can then easily build a CD strategy: Every push on Develop leads to a deployment to the staging environment, and every push on Master goes into production. In this way, you always have the last integrated version on the staging environment and can perform functional or manual tests there before initiating deployment into production by a merge on master. In addition, deployment per feature branch is also possible.
Such a deployment logic can easily be realized with Jenkins Pipelines, since you can query the branch name in multibranch builds from the environment (see Listing 2, Deploy stage).
Where and how to deploy software depends on the project. In recent years, container orchestration platforms have proven to be a flexible tool for DevOps teams. Here, Kubernetes (K8s) has emerged as the defacto standard, which is why this article exemplifies deployment to K8s. Four steps are necessary to deploy an application to K8s:
- Set version names,
- Deploy Docker© Image (build image, with version as tag, and upload to registry),
- Update image version in deployment description (typically in YAML),
- Apply YAML file to K8s cluster.
Listing 2 shows the implementation of these steps in scripted syntax.
node {
    String versionName = createVersion()
    stage('Build') {
        mvn ‘clean install -DskipTests -Drevision=${versionName}’
    }
    // ...
    stage('Deploy') {
        if (currentBuild.currentResult == 'SUCCESS') {
            if (env.BRANCH_NAME == ‘master’) {
                deployToKubernetes(versionName, 'kubeconfig-prod', 'hostname.com')
            } else if (env.BRANCH_NAME == 'develop') {
                deployToKubernetes(versionName, 'kubeconfig-staging', 'staging-hostname.com')
            }
        }
    }
}
String createVersion() {
    String versionName = ‘${new Date().format('yyyyMMddHHmm')}’

    if (env.BRANCH_NAME != ‘master’) {
        versionName += '-SNAPSHOT'
    }
    currentBuild.description = versionName
    return versionName
}
void deployToKubernetes(String versionName, String credentialsId, String hostname) {

    String DockerRegistry = 'your.Docker.registry.com'
    String imageName = “${DockerRegistry}/kitchensink:${versionName}"
    Docker.withRegistry("https://${DockerRegistry}", 'Docker-reg-credentials') {
        Docker.build(imageName, '.').push()
    }

    withCredentials([file(credentialsId: credentialsId, variable: 'kubeconfig')]) {
        withEnv(["IMAGE_NAME=${imageName}"]) {
            kubernetesDeploy(
                    credentialsType: 'KubeConfig',
                    kubeConfig: [path: kubeconfig],
                    configs: 'k8s/deployment.yaml',
                    enableConfigSubstitution: true
            )
        }
    }

    timeout(time: 2, unit: 'MINUTES') {
        waitUntil {
            sleep(time: 10, unit: 'SECONDS')
            isVersionDeployed(versionName, "http://${hostname}/rest/version")
        }
    }
}
boolean isVersionDeployed(String expectedVersion, String versionEndpoint) {
    def deployedVersion = sh(returnStdout: true, script: "curl -s ${versionEndpoint}").trim()
    return expectedVersion == deployedVersion
}
Listing 2
The version name can be generated using Groovy, e.g., as a timestamp in Listing 2. You could create more uniqueness here by attaching the git commit hash. It would also be possible to set a git tag from the pipeline.
To use this version in Maven, using the CI Friendly Versions, available since Maven 3.5.0, is a good option. How this is implemented in the pom.xml is shown in Listing 3.
<project>
    <version>${version}</version>
    <properties>
        <version>-SNAPSHOT</version>
    </properties>
</project>
Listing 3
During the build, the version is then passed to Maven using the -Drevision argument (see Listing 2).
The additional steps in Listing 2 are implemented in a separate step deployToKubernetes(). However, this step is only called after confirming that the build is still stable. If, for example, the Quality Gate failed, deployment should obviously not take place.
Building and uploading the image can easily be done with Jenkins tools thanks to the Docker© integration described in the last article. You have to authenticate at the Docker© Registry. To do so username and password credentials (Docker-reg-credentials in Listing 2) need to be configured in Jenkins. Their origin depends on the registry provider, for example, the password in the Google Container Registry is a JSON file, which is inserted into Jenkins using single quotation marks without line breaks.
To write the version name into the YAML file, you can write your own step to replace in the Jenkinsfile or you can use a plugin.
The kubernetes-cd-plugin is a convenient option. It provides the kubernetesDeploy () step, which filters YAML files and applies them directly to the cluster.
All entries with the $VARIABLE syntax in the YAML files are replaced by corresponding environment variables from the Jenkins Pipeline (in Listing 2, e.g., IMAGE_NAME).
In order to apply the YAML file to the cluster, the plugin must authenticate itself to the K8s master. For this purpose, you create a K8s service account for Jenkins and specify its rights using role-based access control. Listing 4 shows an example of how to imperatively restrict a service account to a K8s namespace. For the declarative variant (in YAML) see https://github.com/cloudogu/jenkinsfiles.
kubectl create namespace jenkins-ns
kubectl create serviceaccount jenkins-sa --namespace=jenkins-ns
kubectl create rolebinding jenkins-ns-admin --clusterrole=admin --namespace=jenkins-ns --serviceaccount=jenkins-ns:jenkins-sa
./create-kubeconfig jenkins-sa --namespace=jenkins-ns > kubeconfig
Listing 4
With this service account you can access the cluster via the K8s kubectl, HTTP API or kubernetes-cd-plugin. The service account is passed to the plugin as a kubeconfig file. This can be done with a script from GitHub, as the last line in Listing 4 shows. The kubeconfig file created by the script is uploaded in Jenkins in a secret file credential, e.g., with the ID kubeconfig-prod (see Listing 2). If you have staging environments in a different namespace, you would create additional kubeconfig files for them (e.g. kubeconfig-staging in Listing 2).
Since applying the file to the cluster only triggers server-side deployment with K8s, it is not yet clear whether this was successful. Therefore, Listing 2 finally checks whether the new version is available. To this end, the application must provide the version name. How to do this with Maven and REST is shown in this blog post. Listing 2 shows how to query the version name and compare whether the version matches the desired one. If it does not show up after a certain amount of time, the build will fail and developers will be notified by Jenkins. In such a case, the use of K8s pays off: Due to its rolling update strategy, the application remains available to a limited extent. The host name is hard-coded in Listing 2. Alternatively, you can query the external IP address of the service using kubectl (see https://github.com/cloudogu/jenkinsfiles).
The implementation of the deployment in declarative syntax is the same as in Listing 2, with the following exceptions:
createVersion()must be called in astepsblock (e.g., within the “build” stage) and writes its result toenv.versionNamesince no variables are possible in thestepsblock.- Checking whether the build is still stable can be done using a
whendirective (see Part 2 of this series). - The branch check in the
Deploystage must take place within astepandscriptblock or in a separate step.
The complete example can be found at GitHub.
Of course, deployment to environments other than K8s is also possible from Jenkins pipelines. For example, deployment to the container orchestration platform Docker© Swarm is easy thanks to built-in Docker© support. Docker© itself can also be used to build simple staging environments by including a Docker© host machine as a Jenkins worker and then launching the containers of the staging system from the pipeline. Deployments on PaaS platforms are also possible, e.g. CloudFoundry has a plug-in with pipeline support.
In addition to web applications, other types of applications can also be delivered continuously. In conclusion to this article, here are some practical suggestions:
- Java libraries can be deployed to Maven Central with just a few lines of pipeline code. An example is the test-data-loader, which uses ces-build-lib the shared library.
- Docs as code
- Documentation written in a markup language and stored in the SCM can be automatically converted into a finished document. This example shows how Markdown uses Pandoc to create various document formats, such as PDF or ODT. Using Pandoc’s template mechanism, the documents can be rendered in corporate design. This example uses the Gulp build tool to do the build locally. In the Jenkinsfile, the environment necessary for Gulp (node.js, Yarn) is provided in a Yarn container. In it, Gulp uses the cloudogu/pandoc container for document creation. Therefore, this is the
Docker in Dockerchallenge described in the last section. To start additional containers from the Yarn container, the Docker© socket is passed through and the Docker© client is installed. This can also be solved in a few lines using ces-build-lib. If you edit the markup in a git-based wiki like Gollum or Smeagol, a PDF will be delivered directly by the CD pipeline upon saving. This makesdocs as codemore accessible to non-developers. - This also works for presentations. This example shows how to create presentations with
reveal.jsin Markdown and make them available in a Maven site (Nexus repository) or via Kubernetes (NGINX container) on the web.
- Documentation written in a markup language and stored in the SCM can be automatically converted into a finished document. This example shows how Markdown uses Pandoc to create various document formats, such as PDF or ODT. Using Pandoc’s template mechanism, the documents can be rendered in corporate design. This example uses the Gulp build tool to do the build locally. In the Jenkinsfile, the environment necessary for Gulp (node.js, Yarn) is provided in a Yarn container. In it, Gulp uses the cloudogu/pandoc container for document creation. Therefore, this is the
- Infrastructure as code: Even entire virtual machines can be provisioned in the cloud, e.g., using the Terraform tool.
Conclusion and Outlook
This series of articles shows some of the possibilities offered by the Jenkins Pipeline plugin. It combines the existing large selection of Jenkins plugins with a DSL to describe build jobs. This way, you can formulate build jobs as code. These are easier to understand, can be managed in SCM, reused more easily (for example, using shared libraries) and tested automatically. Parallelization also makes it possible to leverage existing resources to shorten pipeline runtimes with minimal effort. The Docker© integration allows the use of additional tools and the ability to make images available in a registry during deployment without additional configuration.
Whether one describes pipelines in scripted or declarative syntax remains a matter of taste. While writing the examples for this article, the declarative solution was often more cumbersome, but generally feasible, especially for more complex tasks. The advantage of declarative pipelines is that they are better integrated into the Blue Ocean theme and can be edited there visually.
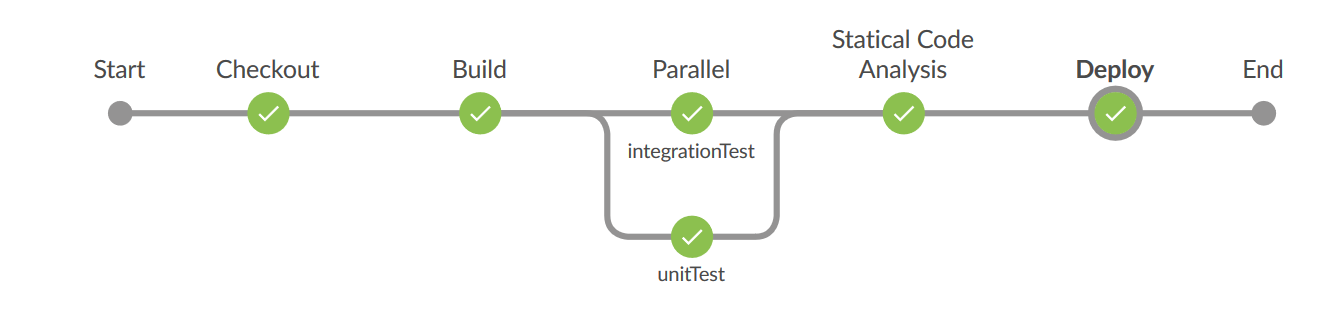
The final pipeline (see Figure 1) contains approximately 150 lines in both variants. The complexity of the project is quite similar to that of a “real” project.
In a few places (e.g., nightly builds, pipeline unit and integration test possibilities), it turns out that not everything is perfect, yet. Nonetheless, the Pipeline plugin is Jenkins’ most important innovation over the last few years and ensures that we can continue to use the veteran Butler for modern software development.
+++ If you want to read the post in German, you can download the original article, published in Java Aktuell 04/2018. +++
Individual consulting services
Create the optimal framework for first-class software development in your company – with Cloudogu.
Request consulting
This article is part 4 of the series „Jenkins Pipeline for continuous delivery“.
Read all articles now:


