


03/06/2015
in EcoSystem
Static Code Analysis with SonarQube
Table of Contents
An easy way to implement continuous code inspection to software development projects is by using SonarQube. It offers various code inspection rules for a large number of programming languages. The application can be connected to Continuous Integration servers like Jenkins, Hudson, Gerrit, Bamboo or TeamCity via plugins. It provides you with a dashboard that tells you about the code quality of your projects. SonarQube is installed and ready to use on Cloudogu EcoSystem.
Try it yourself and install a complete toolchain in less than 30 minutes:
Cloudogu EcoSystem quickstart guide
Cloudogu EcoSystem quickstart guide

SonarQube in General
The tool SonarQube is developed by SonarSource and was first released in 2007. Back then the name was Sonar. In 2013 the name was changed to SonarQube because of trademark issues. The application executes static code analyses on your projects.

Quality in software development
SonarQube is an easy to use tool that helps you to keep track of the code quality of your projects. The analysis covers the 7 axes of code quality and the results are displayed in a dashboard.

In addition to the analysis results it is possible to browse the code. For example if SonarQube detects a potential bug you can directly take a detailed look at the code to find its source. The application also allows you to keep track of the progress of your projects over time, because it enables you to easily compare analysis results from different points in time.
Code Analysis with SonarQube
As mentioned before each code analysis by SonarQube covers the 7 axes of code quality. Those are:
- Comments: Shows the rate of comments in your code.
- Coding rules: SonarQube comes with a predefined set of coding rules which can be adjusted to individual needs and standards.
- Potential bugs: Shows sources of potential bugs, e.g. if a method uses the same code for two branches.
- Complexity: This is the cyclomatic complexity (or McCabe metric) which increases whenever the control flow of a function splits.
- Unit tests: Shows the code coverage with unit tests.
- Duplications: Reports on copy/paste and code duplications.
- Architecture & design: Analyses file dependencies and directory structure of the project.
As described in our article about automatic code review with SCM-Manager Universe, SonarQube can be used to define thresholds for metrics. This helps you to improve the quality of your projects, because each violation of a threshold results in a warning. The difficult thing is to find the right metrics and their limits for you.
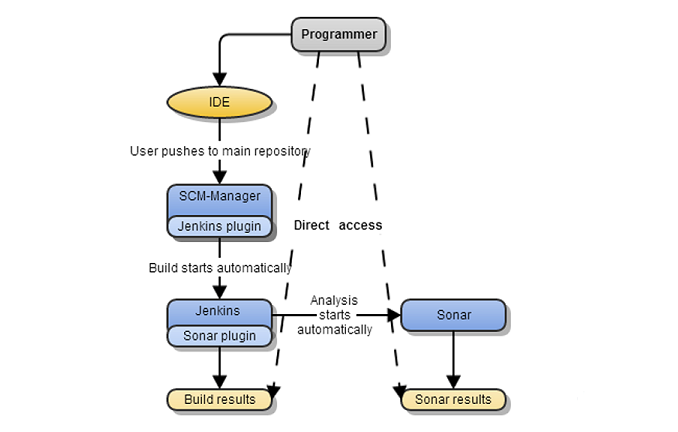
SonarQube integration with Jenkins
The default workflow in Cloudogu EcoSystem allows you to launch a SonarQube analysis as part of the build process in Jenkins.
If you want to launch a code analysis you can do that as a pre- or post-step of the build process in Jenkins. The option can be selected in the job configuration screen.
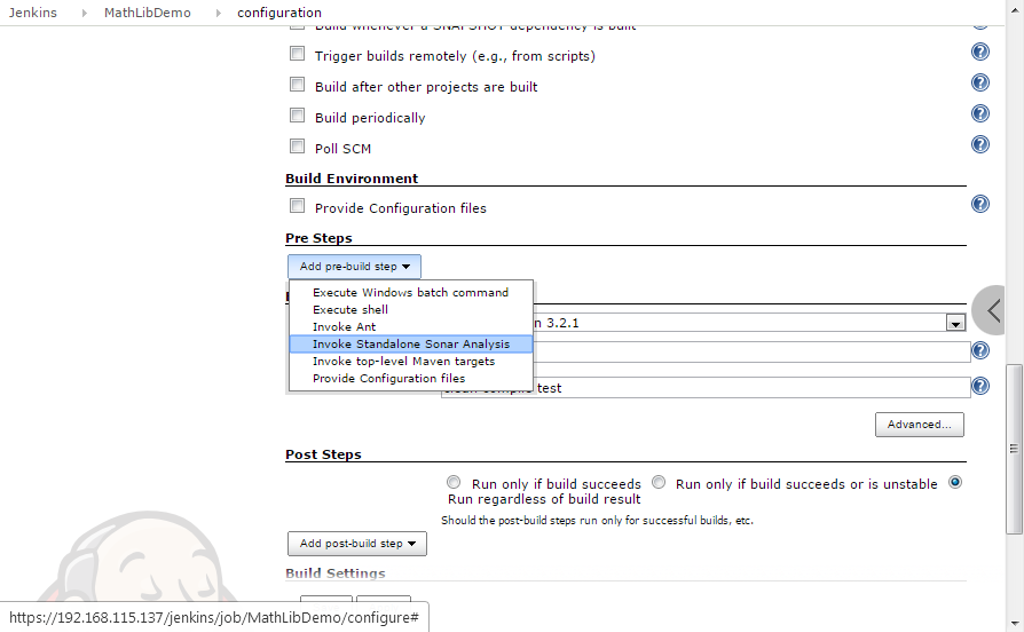
In case you are using Maven you need to configure SonarQube in the pom.xml. If you are not using Maven, e.g. in a Freestyle project, you need to configure SonarQube Runner.
We recommend to start using SonarQube with the default quality profiles/set of rules and to adjust them step-by-step to the needs of your projects.
Benefits of quality profiles
Using SonarQube offers a lot of possibilities to improve the code quality of a project. Even if you don’t individualize the set of quality rules and don’t implement individual metrics you can keep track of the default ones. Cloudogu EcoSystem comes with the default rules, because the users should make their own modifications; quality is very project and team specific. So take your time to establish your own custom metrics and thresholds for warnings. This way you can protectively improve your code quality. In each case it is inevitable that you know what the metrics stand for and what they mean. Otherwise it’s not possible to derive measures for quality improvements. So take your time and learn about the metrics, it’s totally worth it.
Automatic Code Reviews with SonarQube and Jenkins
It is also possible to implement an automatic code review by using SonarQube in combination with Jenkins. Our tutorial explains how you can configure warnings in case a threshold for a metric isn’t met. If that is the case the build for the project will break.
Try the toolchain with SonarQube yourself
If you’re already using Cloudogu EcoSystem, you simply have to install the SonarQube Dogu. During the setup, all the necessary configurations will be done automatically. If you don’t have an EcoSystem of your own yet, you can check out our playground. You can for example commit changes to the demo project “spring-petclinic” or start a build in Jenkins manually to invoke a code analysis by SonarQube.
Cloudogu EcoSystem
Convince yourself of the advantages of the Cloudogu Ecosystem. Use the modern DevOps platform now for free.
Learn more about itNote: On Oct. 2nd we adapted the post to Cloudogu EcoSystem


